PRIMER
Primer, Feb 15th, 2021
New Formats, Better Results
We’re going to try an experiment for a while.
Over the past few years, most of the content inside of IncomeLab has been in video form. And it has been great, but there absolutely are tradeoffs.
For example, from my stats I know about 20% of members will watch the videos– if my ideas and setups aren’t easy to consume, then it won’t help you.
For a while we’re going to try doing just text-based analysis. This will help for a few reasons:
- I can organize information easier and circle back to previous themes we’ve talked about
- I can get trade setups sent out faster as I don’t have to wait on video processing and uploading
- It is easier to read and reference during the trading sessions
- We can look back together and see which ideas are working out, and which aren’t– failed signals are just as important as fulfilled ones.
This will take more of my time, but I believe it is time well spent as it helps me, and I believe it will help you.
If you’re going to miss the sound of my voice, don’t worry– we will setup some webinars and “Happy Hours” so we can work together to build your accounts.
I also want this to be much more “two-way,” as some of the best trade setups have come from clients at IncomeLab. Make sure you’re in the facebook group, as that seems to be the best way to do things.
Our new format will include broad-based market analysis, followed by trade setups.
Let’s get down to it.
The Institutional Catchup Game
Let’s circle back all the way to the volpocalypse trade in February 2018. What happened?
- Too many participants were blindly short vol with XIV, SVXY, short TVIX, short VXX, and other exotic products like variance swaps
- This trade is incredibly crowded, but it continues to last for the entire year of 2017.
- At some point, the volatility market gets too far over its skis, and XIV breaks. I definitely am a conspiracy theorist in this– someone read the XIV prospectus and tipped the VIX futures market just enough over the edge to completely break it. I think there are still open lawsuits against Credit Suisse
We have a rough idea of how this works:
- Crowded trade
- Liquidity breaks
- Institutions caught offsides on a trade and forced to cover
I believe that the Volpocalypse caused a structural break in the markets. The nature of liquidity and convexity in the options market changed, and we started to see more “tail wagging the dog” scenarios.
Now fast forward to April of 2020. Markets crashed, institutions were caught offsides (again). So many things broke:
- Short vol (again)
- Leveraged risk parity
- Uncapped variance
- Exotics tied to variable annuities
- Crude oil went negative
When I saw this, it was my belief that so many firms were blown out that there was simply no participants left to sell things. That’s when I made the call for a “v-bottom” in the markets.
And boy did we see one, but it wasn’t a broad based rally. Deflationary (tech) stocks were the best performers, while more sensitive names didn’t do much.
Yet it was still a similar kind of framework as I showed earlier– liquidity just isn’t as robust as it used to be, and this is a long term structural risk in the markets.
And risk can run to the downside… and the upside.
Here’s a look at the Russell 2000 index, with the deviation away from it’s 50 week moving average:
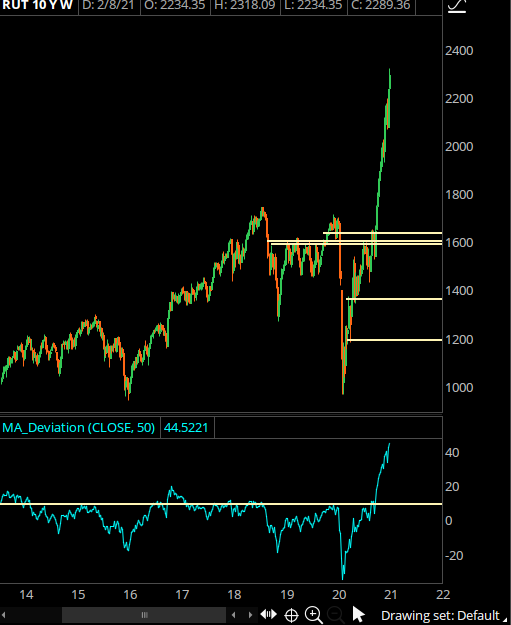
Right now the Russell 2000 index is 44% above its 50 week moving average. That’s not just overbought, that’s several standard deviations away from what we’ve ever seen before. The highest peaks we’ve seen previously were around 20%, so we’re about double that.
This doesn’t “make sense,” but it also makes sense. Into the Pfizer vaccine and the Georgia special election, institutions were caught offsides (again) and were forced to make a buyback into a trade that nobody was taking.
Here’s the weekly performance of IWM to QQQ:
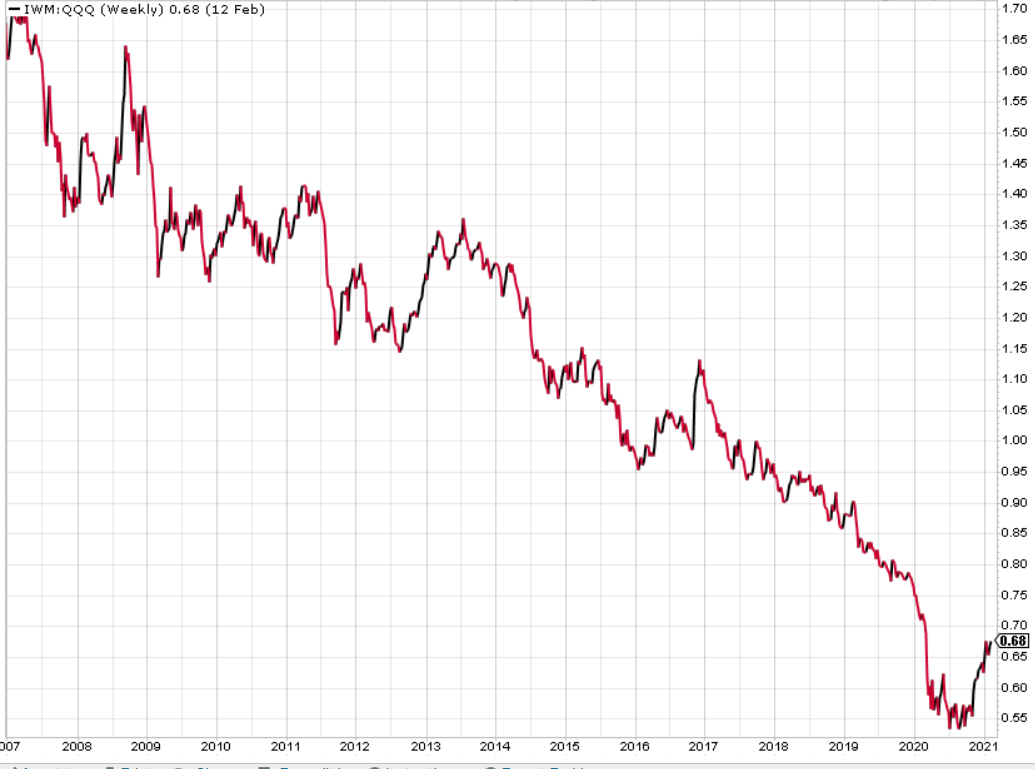
Whether this is a cyclical or secular turn remains to be seen. There’s some other mechanics related to rates we’ve discussed last week (see the PDF), yet the speed with which we saw this move was something special.
Think about the concept of liquidity for the moment. I’m sure there’s some fancy microstructure ways to define it, but the easiest for me is:
“How much energy does it take to move a market?”
In very liquid environments you will see higher reversion, sideways action, and an inhale-exhale model.
This is not a liquid market.
You’ve got all the mechanics we just discussed, but also remember that the vast majority of market participants are in passive funds– they regularly buy index funds and will rebalance… but those are “known knowns” and won’t move markets.
We’re dealing in the margins now. It does not take much to move the market, both higher and lower.
I’m aware of the elephant gun coming with the fiscal stimulus round two that’s being monetized, but that’s more macro and I’m focusing more on structure.
The structural risk is what has me concerned:
- Funds are now in a crowded trade (re-long smalls, banks, commodities)
- Structurally, liquidity is less
- When do institutions get caught offsides (again)?
I don’t have an answer to part 3. I’ve tried (unsuccessfuly) to short the R2k a few times and it just hasn’t worked, yet I will continue to bet on liquidity breaks.
Speaking of which…
Convexity is Still Working
Another part of market history for you:
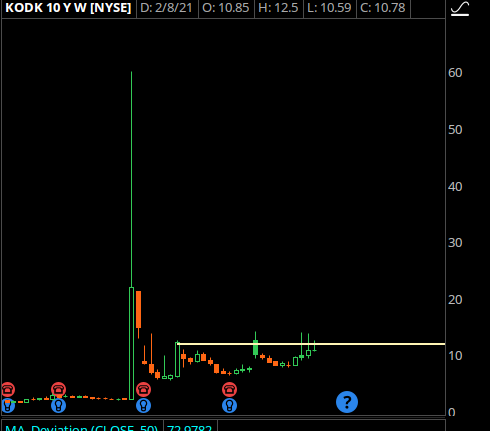
Template still works, but on a more micro time-scale:
- Institutions caught short in size a parabolic runner
- Liquidity breaks
- Stock runs from about 5 bucks to 60 in a single day
This is just as important to what’s going on in the markets as the volpocalypse.
The blown up KODK short led to structural changes in these parabolic names. Short-biased traders aren’t willing to go all in on the front side because of this move… and you can see that reflected in low float stocks since then… traditional patterns of “shorting the third day” just don’t work as well anymore because of this one move.
Transfer that concept over into the options market. For nearly a DECADE, short vol was a crowded trade, not just on the downside but on the upside. You used to get paid selling call spreads or calls into stocks that are going straight up.
Not so much anymore. You think I’ll talk about GME? Nope, go a little further back.
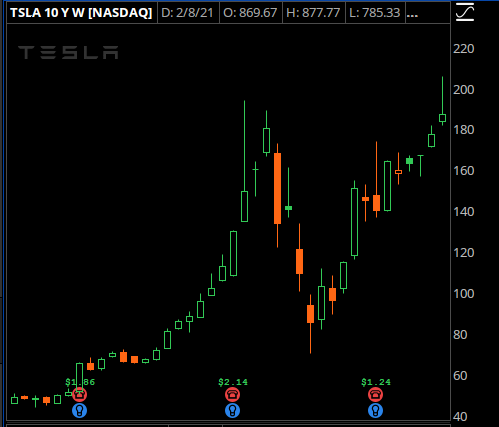
This first parabolic move in TSLA is where I started to see upside convexity seriously pay out. We’ve seen it work before, but not to the size and scale that we saw TSLA move. And this isn’t even the only time it’s happened, we’ve seen “convexity squeezes” on this stock 2-3 more times since then.
Again, similar structure:
- Institutions and dealers caught short calls in size
- Liquidity breaks as gamma squeeze takes off
- Institutions caught offsides (again)
Sensing a pattern?
This move in TSLA paved the way for what we saw a few weeks ago in GME, AMC, BB, NOK, KR, FIZZ and several others.
Market participants are becoming more aware of when a large trade is caught offsides, and it works better now because of liquidity and structural shifts in the market.
All of these concepts have drastically shifted how I approach the markets.
You can’t afford to be a “blind contrarian” and short stocks and other instruments just because they are “up too much.” Instead, we need to think about who is caught offsides, what funds are forced to play catchup, and where the next rotation will be.
There will absolutely come a time when you will need to have some aggression to the short side, we simply have not seen anything to lead to that case.
But the hairs on the back of my neck stand up when I see things like this:
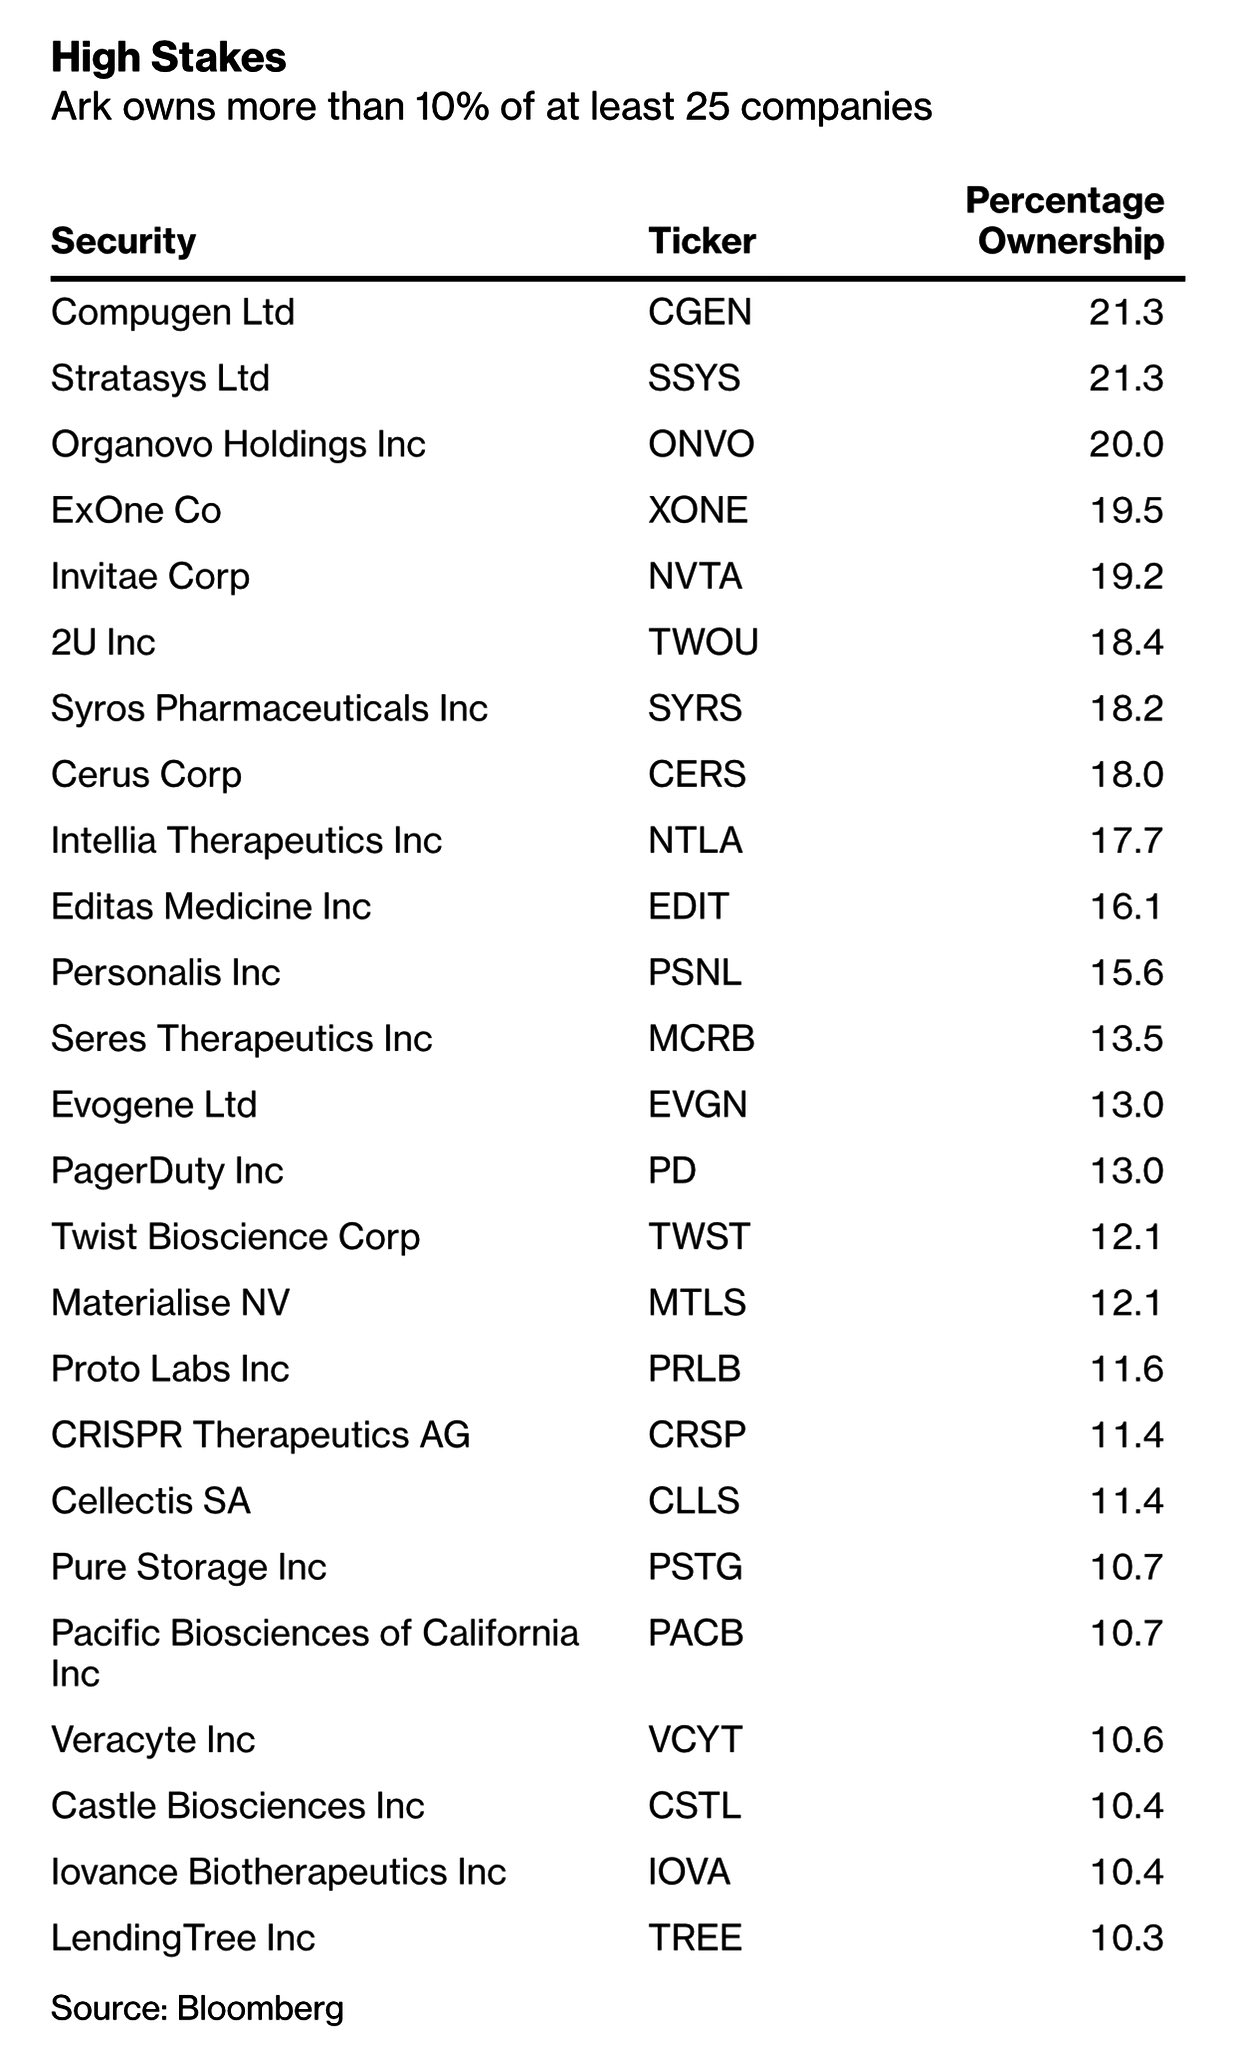
This is a list of names that Ark holds in serious size. They own 20% of the float in SSYS and ONVO
Here’s a weekly chart of SSYS:
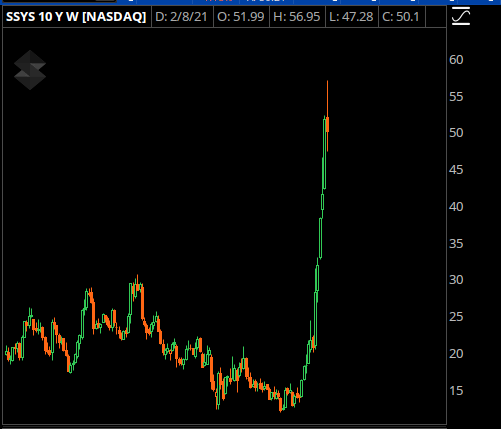
15 bucks to 55 since November.
What happens to these stocks if the tide turns, ARK gets caught offsides, and they have to sell into a low-liquidity environment when they get redemptions?
Start considering the conditions you want to see in these names that would make you interested in playing them to the short side. Failed breakouts, selloffs into good news, and retracement shorts all catch my eye.
The Next Rotation
Hot money is flush right now. There have been some massive wins for momentum traders recently, and there has been a rotational theme we’ve been seeing.
Last week, the big runner was the “wellness” space.
“Wellness” is what wall street calls weed stocks.
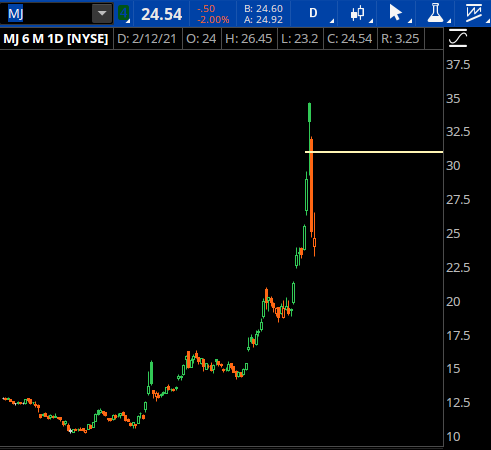
This is MJ, a sector ETF. It runs from 20 to 35 over a week and a half, and retraces a ton of it as profit takers come in.
First off, there are some amazing opportunities right now by selling puts or selling put 1×2’s in names like TLRY, ACB, CGC and others. They will (most likely) develop a floor here soon and just chop around for a bit as the churn brings out new buyers.
What I want to focus in on right now is where the hot money could flow next.
It’s been very beneficial to buy calls, even deep out of the money calls, before the breakout happens, and start to sell into the breakout. That still offers the best risk/reward, and all the mechanics that we’ve discussed allow this mechanic to continue.
Let’s keep it simple. What’s a momentum space that simply hasn’t run recently?
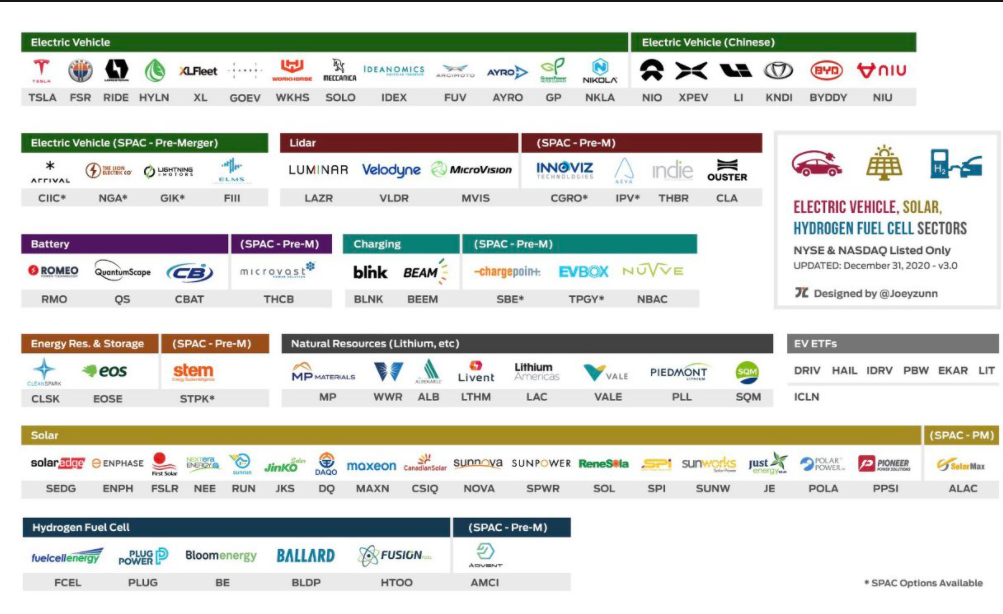
I’m watching the EV (electric vehicle) space.
This diagram has come in very handy for finding potential breakouts and sympathy runners in EV stocks:
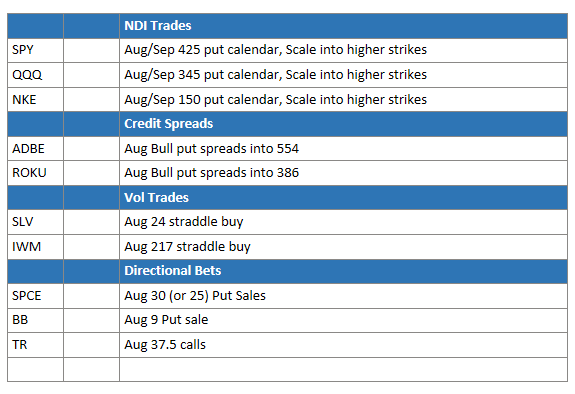
Here are some of the names that I like, along with some setups to consider:
LAZR
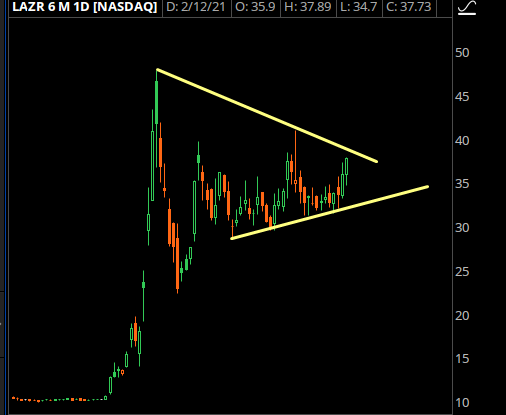
Aggressive Play: Feb 40 calls
Less Aggressive Play: March 50 Calls
Conservative Play: Sell March 30 puts with stop under 10 day low
VLDR
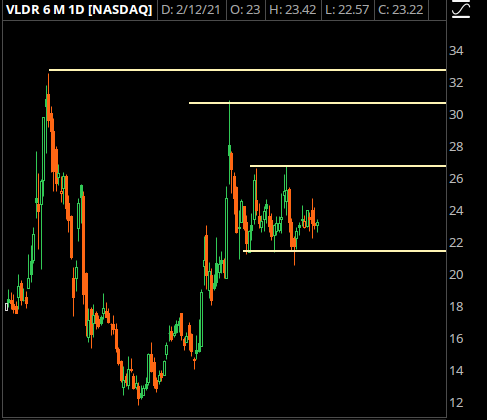
Aggressive Play: March 40 calls, sell half at double, sell rest when you can buy a boat with the profits
Conservative: Buy March 30/40 Calls, Sell 2x 15 Puts (This structure works exceptionally well on these names.)
SOLO
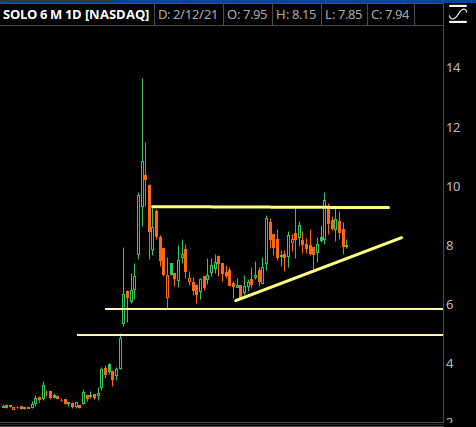
Aggressive: March 11 Calls, Selling half at a double and selling rest for at least a triple
Conservative: Buy March 10/12.5 Call Spread and sell the 6 puts, run a stop under 6 bucks for the put sale
THCB
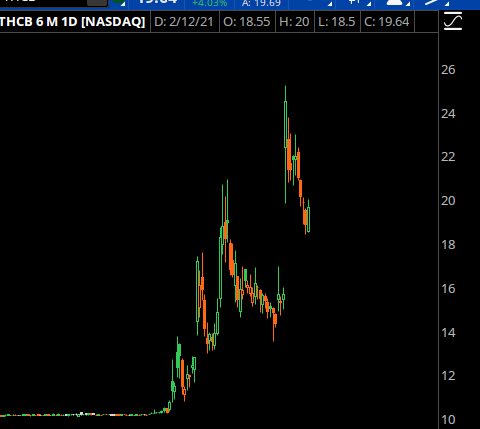
It caught a run on the announcement that they’re bringing Microvast onto the market, and it’s seeing the post-news hangover that is almost a requirement for SPACs now.
Selling March 15 puts for anything above 50 cents is a good trade, and I’d be a very willing buyer back at 15 bucks.
First Pull Hangover Plays
I call these Hangover plays because these are the stocks where the “party is over.” Your parents are coming home, the house is trashed, there’s some guy you don’t even know who is asleep on the staircase, and you’ve got to deal with the consequences.
This has been a fairly easy trade– meaning that while everyone else is experiencing the hangover, I have the opportunity to come and steal all the booze that wasn’t drunk.
And that booze comes in the “option premia” flavor. There is a tendency for these names, when they go parabolic, to have the option premiums skyrocket higher.
Once they have a hard pullback, those puts don’t pay out… in fact, they may not pay out at all or decline. That’s the bet I want to take.
Here’s an example in MVIS
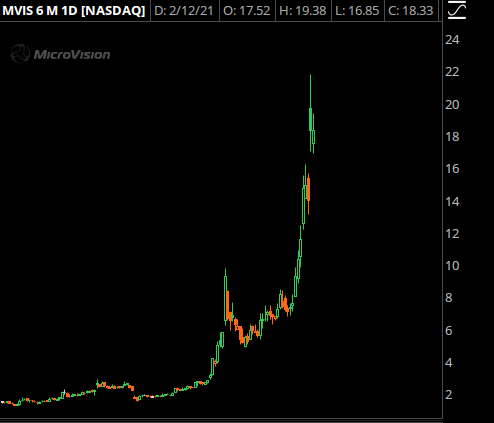
It’s a Bitcoin proxy, and has seen a 10x run from the lows in November. At some point, it will get absolutely crushed, but because those puts are running so hot it becomes very difficult to profit looking for a crash.
Instead, wait for the hangover. Wait for the stock to get crushed, then you can easily sell puts into the blood.
Here’s the wild thing. Right now, the March 8 puts are going for 0.55. That means you can get paid 55 bucks to buy the stock at 8 bucks, which would be a full 100% roundtrip on the most recent parabolic move.
That sounds like a good deal on its own, and if/when the stock gets crushed you should be able to pull out 1.00 in that contract.
Don’t expect super rich premiums… we’ve recently seen instances where the option skew curve is completely goofy as a ton of people want to own these stocks at lower prices.
Here’s an example in TLRY at the close
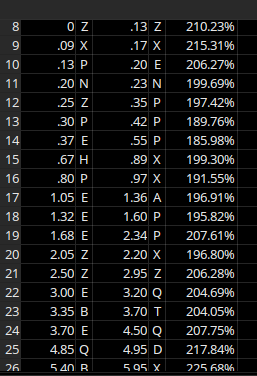
Here’s the columns: Strike price, bid, ask, IV
In a “normal” options chain, you’d see IV much higher on further downside strikes as investors want to hedge against tail risk.
But in these momentum names, after they get crushed, you’ll see willing option sellers that will “kink” the skew curve. See how the 15 strike has a vol of 199 while the 26 strike is at 225%?
You want to sell the lower IV strikes as that’s where you have the highest odds of the stock holding. It sounds counterintuitive but that’s what we’ve been seeing recently.
I’m currently short some TLRY Feb 30s, I sold the 23 puts and flipped out of them on Friday, and I will be selling March puts into the stock next week.
More Setups Coming This Week
Wow, this is a lot harder to do than a video, but it has a better feel for me as I have been forced to write out trade setups instead of quickly going over them on a video– hopefully better staying power.
In this Primer, we’ve addressed a few thematic setups which I think are good to go this week. I have plenty of other ideas, but I am simply out of time for now. I’ll will flesh them out throughout the week so I can help you find the best setups available.
Talk Soon,
Steve