Same gameplan here… go unbalanced on the call side as the upside risk will hit us hardest if it does come.
Here’s the fill sheet to show you what to look for:
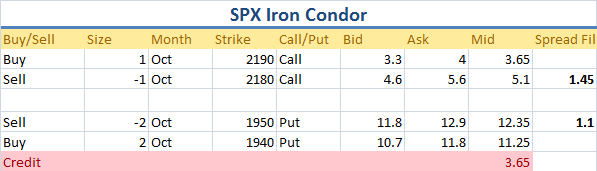
So on the Put side you should be gunning for 1.10, if the market gets soft here then you’ll get it. Go as low as 1.00 if you need to walk the order down.
On the call side you want to get 1.40. At least get 1.30.
If we see a move to 2150 we will roll and add on the call side.
If we see a move to 2000 we will hedge by purchasing some Nov put spreads.

Update: Aug 21, 2015
Going to close out the call side here and will re-sell call spreads into any pop.
Buy to Close SPX Oct 2180/2190 call spread @0.20
Sell to open SPX Oct 2130/2140 call spread @1.60
DO NOTE:
That new call spread is currently going for 1.35. That means to get a fill you’ll need a pop in the markets. So you probably just want to float a GTC odrer out for next week.
Update: Aug 27, 2015
I’m not going to lie, income trades have *sucked* in this tape. That’s obvious of course as seen by the swings in the unrealized p/l in the trade.
It seems I’m going to have to dance for my money this quarter.
Here’s what we’re going to do… this trade only has the short put side on, and the intent was to sell those 2130/2140 call spreads at 1.60.
Well we’re not going to get that price. Even if the SPX pops, the IV will drop, so we’re going to have to go with lowe prices:
Sell to Open SPX Oct 2130/2140 Call Spread @1.00
This is still *half size*. We’re doing that so if the SPX does manage to rip back to 2100 we will be able to roll and add the trade.
This helps improve the credit, but it still doesn’t remove a significant amount of downside risk.
Here’s the tricky part… there’s no *easy* way to cut the downside risk cheaply.
Here’s the hedge I’m going to use:
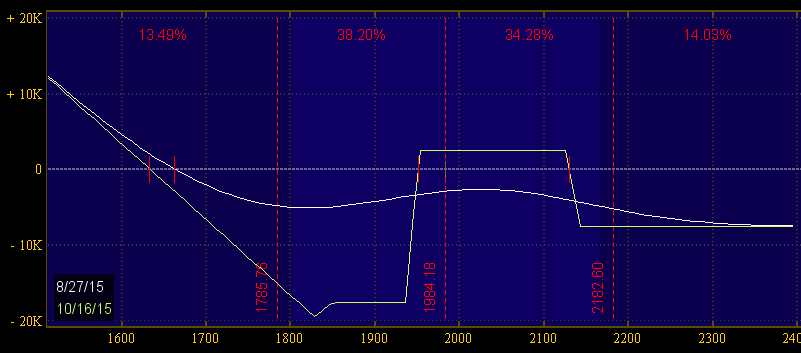
Buy Oct 1850/1830 Put 1×2 @20.00
So this trade you’re selling the 1850 put and buying 2x the 1830 put. It cuts my delta from 27 down to 10, which is more manageable.
If you’re trading less size, then the equivalent hedge in SPY is the Oct 185/183 1×2… you could also consider just buying some Nov SPY puts straight up. Just find a way to cut your delta by 50-60%.
This hedge is going to be on for only 10 trading days. If things “clear up” then we’ll take the hedge off.
The problem with this hedge is if the skew flattens or the vix drops hard it stops being an effective hedge. I think that could be a risk but not in the near term.
If the market tanks again we’ll take off the hedge and use those profits to roll the put side lower.
Update: September 9th, 2015
I think that eventually the market will go retest the Aug lows. At the current risk structure we have on, that is an unacceptable level of risk. So we’re going to adjust this trade again to reduce our downside risk.
The trade will be split up into two main components:
1. Sell more call spreads
2. Roll the put spreads lower.
Selling the call spreads helps to pay for 50% of the cost of the roll.
So step 1:
Sell to open Half Size SPX Oct 2090/2100 call spread @1.10 or higher
Step 2:
Buy to Close Full Size SPX Oct 1950/1940 Put Spread @3.30
Sell to Open Full Size SPX Oct 1910/1900 Put Spread @2.40
If/when the market sells off aggressively again, We will clsoe out the downside hedge and use those hedge profits (along with roll some call spreads lower) as a way to adjust the put spread side again.
If the market rips even higher, into the 2030-2050 area then I will scale out half of the put spreads with intent to re-sell them.
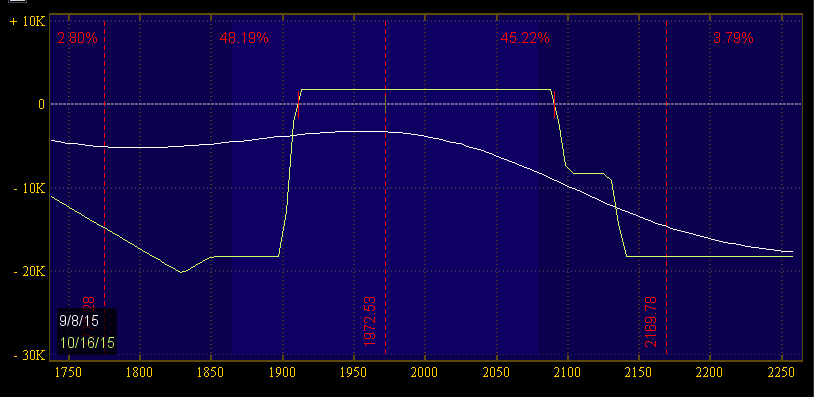
Here’s the trade risk after the adjustments:
Update: October 16th, 2015
SPX settled at 2030 so all options expired worthless. (This is a good thing.)
P/L Calculations
Put Spread 1
Sell to Open 10 SPX Oct 1950/1940 Put Spreads @1.1
Buy to Close 10 SPX Oct 1950/1940 Put Spreads @3.30
Loss: -$2200
Put Spread 2
Sell to Open 10 SPX Oct 1910/1900 Put Spreads @2.40
Expired Worthless
Profit: $2,400
Call Spread 1
Sell to Open 5 SPX 2180/2190 Call Spreads @1.45
Buy to Close 5 Oct 2180/2190 Call Spreads @0.20
Profit: $625
Call Spread 2
Sell to Open 5 Oct 2130/2140 Call Spreads @1.00
Expired Worthless
Profit: $500
Call Spread 3
Sell to Open 5 Oct 2090/2100 Call Spreads @1.10
Expired Worthless
Profit: $1,100
Hedge
Buy to Open Oct 1850/1830 Put Spread @20.00
Expired Worthless
Loss: -$2,000
[This hedge sucked, next time buy straight puts to hedge delta/gamma. China was crashing though…]
Total P/L
Put Spread 1: -2200
Put Spread 2: +2400
Call Spread 1: 625
Call Spread 2: 500
Call Spread 3: 1100
Hedge: -2,000
Total Profits: 425
Margin Explanation
Spread Margin: 10,000
Put side credit: 10 @ 1.10 = 1100
Call side credit: 5 @ 1.45 = 725
Initial Margin: 8175
Adjustment #1:
Close 5 Call Spreads @0.20
Margin Increase +100
8275
Adjustment #2:
Open 5 Call Spreads @1.00
Margin Decrease -500
7775
Adjustment #3:
Buy 20-Wide 1×2 @20… Cost is 20 and width is 20
Margin Increase: +4000
11775
Adjustment #4:
Open 5 Call Spreads @1.10
Margin Decrease -550
11225
Adjustment #5:
Roll 10 Put Spreads For 0.90 Debit
Margin Increase +900
12125 (Max Margin)