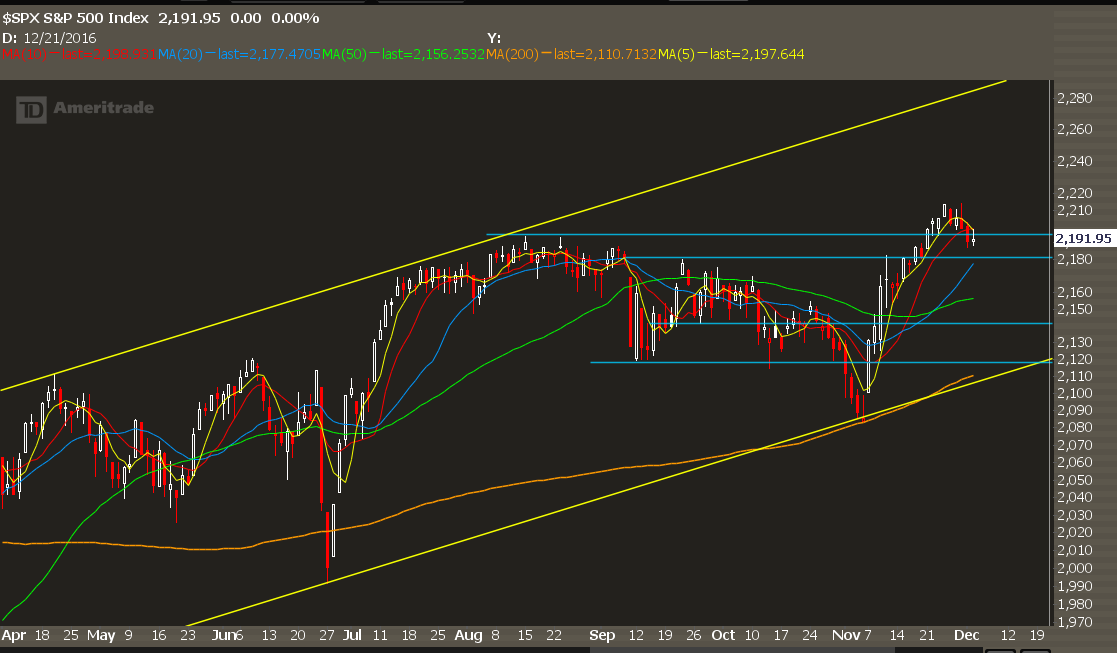
The price action for the past few weeks has been an echo of the catalyst move from the US elections.
Should we expect the same kind of volaitlity to continue?
Probably not.
Look at the previous example from the summer with the Brexit vote. Markets sold off hard, then reversed hard, and then went into a chop for at least another two months. Within that chop were clear bull and bear trends in individual sectors, but on the whole it was a wash.
I’m expecting something similar to develop here. While we only see it in overnight charts, stocks went limit down overnight during the election results, only to finish green and see massive continuastion higher.
From here, we should see more sideways action in the indexes, with a more “rotational” kind of correction.
The next big event is the Fed meeting and that is certainly driving some of this rotation. Bank stocks look great, commercial real estate stocks look like hot garbage.
A good trade theme for the next few weeks is to look at areas that have significantly outperformed everything else, and buy into their pullbacks. I’m also looking for the “eventual” money flows back into large cap tech stocks.
Trade #1: Facebook (FB)
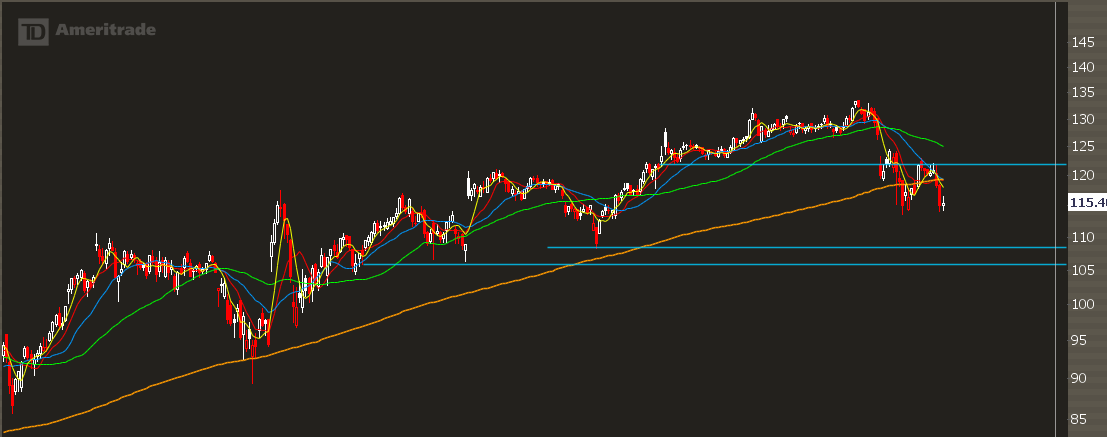
While the longer term trend remains in tact, the intermediate term technicals continue to turn sour.
They key pivot level at 122 held as resistance, and we saw more aggressive selling throughout the week.
I’m looking to buy the dip, but only at the next support level starting at 109. If we get there quickly then we have a great parabolic long setup.
Trade Setup
Expected Stock Price: 109
Sell to open FB Jan 105/95 put spread
Tier 1: Enter at 0.60, exit at .20
Tier 2: Enter at 0.90, exit at .60
Tier 3: Enter at 1.20, exit at .90
Trade #2: RUT

After what felt like an eternity, the Russell 2000 index finally had a pullback.
In the grand scheme of things, this is still not enough of a downside move to justify getting long.
Yet you must understand… when an index has a move like this, it has a bullish expectancy over the next 20 days or so. I think that any pull into 1300 is a good entry point. That’s where the rising 20 day moving average is, and just underneath that is a pullback to breakout setup.
Trade Setup
Expected Stock Price: 1300
Sell to open RUT 1200/1195 put spread
Tier 1: Enter at 0.65, exit at .25
Tier 2: Enter at 0.90, exit at .60
Tier 3: Enter at 1.20, exit at .90
Trade #3: TXN
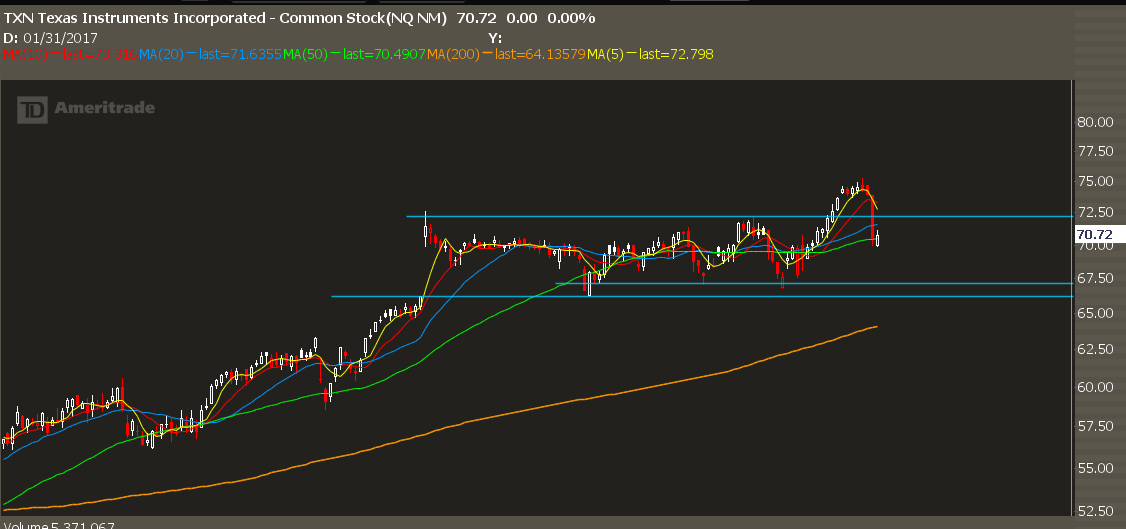
This has “failed breakout” written all over it.
After a move above its earnings high from a few months ago, the stock had a multi-standard deviation move back underneath that level.
When we see a failed breakout like this, we should expect a run back to the other end of the range. That’s at 67.50.
Trade Setup
Expected Stock Price: 67.50
Sell to open TXN 62.50/60 put spread
Tier 1: Enter at 0.30, exit at .10
Tier 2: Enter at 0.45, exit at .30
Tier 3: Enter at 0.60, exit at .45