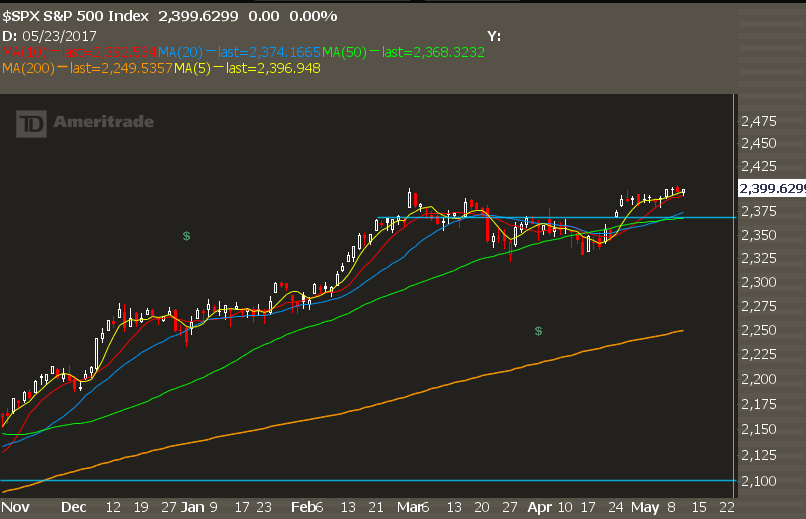
While the S&P keeps attempting to clear 2400, I have a troubling statistic to share with you.
We can measure the actual volatility of the market to compare it to the implied volatility in the options market (we normally use the VIX).
So yeah, the VIX is under 10%, which hasn’t happened in over 10 years.
But something more extraordinary is taking place.
The 10 day volatility for the S&P is under 3%.
At 2.64% to be exact. This means if we were to see the same kind of vol like we have over the past 10 days, then we should expect to see the market higher or lower by only 2.6%.
That’s crazy low vol.
It’s not the same underneath the surface. Earnings season has given us plenty of movers, but averaged out it’s not much of an impact.
My approach here is to look for volatility in individual names after their earnings as they’ll give the best opportunities.
Trade #1: DIS
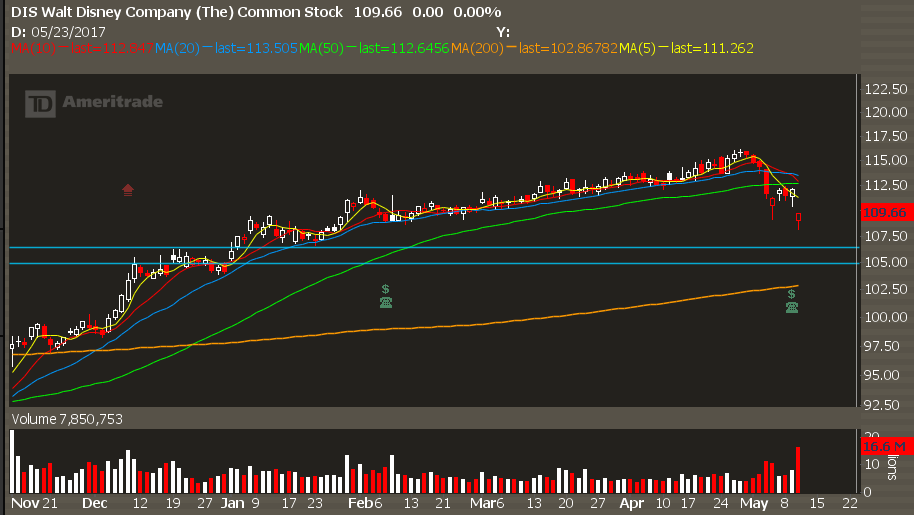
We’ve got a gap down on earnings. I never fade the first move, but if we get a stretch into 106 then we have a pb2bo (pullback to breakout setup) that came through.
Trade Setup
Expected Price: 106
Sell to Open DIS Jul 100/97.50 Put Spread
Tier 1: Open at 0.35, Close at 0.10
Tier 2: Open at 0.50, Close at 0.35
Tier 3: Open at 0.65, Close at 0.50
Trade #2: CELG
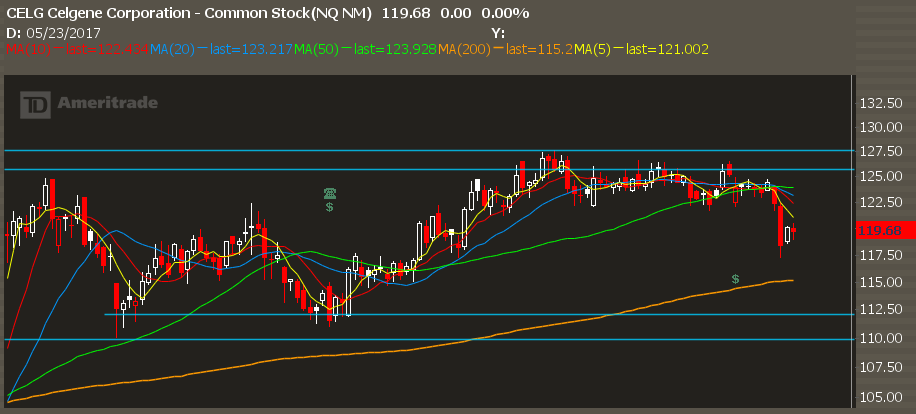
CELG had a volatility pivot on the back of XLRN earnings, one of their pharma partners.
I want to be really, really patient on this one. Look for a run to the lower end of the range before we start looking for spreads to sell.
Trade Setup
Expected Price: 113
Sell to Open CELG Jul 105/100 Put Spread
Tier 1: Open at 0.80, Close at 0.30
Tier 2: Open at 1.10, Close at 0.80
Tier 3: Open at 1.40, Close at 1.10