We’re going to start off today with a look at some historical price action.
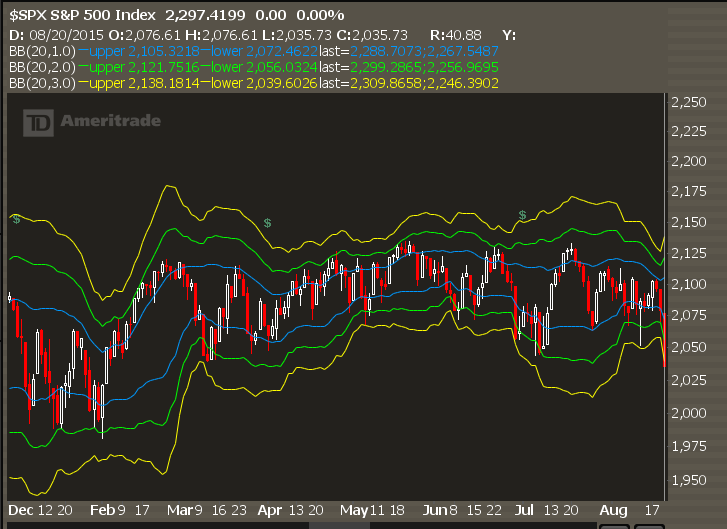
This chart shows us how the S&P 500 traded for the first 8 months of 2015.
No trend, all reversion. Buyers didn’t really show up… neither did sellers.
This is what we call “normal” in the markets. Periods of low volatility followed (eventually) by some very strong price movement.
And while I think we trade higher from here… it’s not going to be a ripper higher.
The one thing that this chart doesn’t show…
Was how during the entire year in 2015, there was a massive bear market underneath the surface in oil. The entire sector collapsed but you didn’t see it in the broad markets.
When correlations are this low, there’s still plenty of opportunities to be had out there.
Trade #1: AMZN
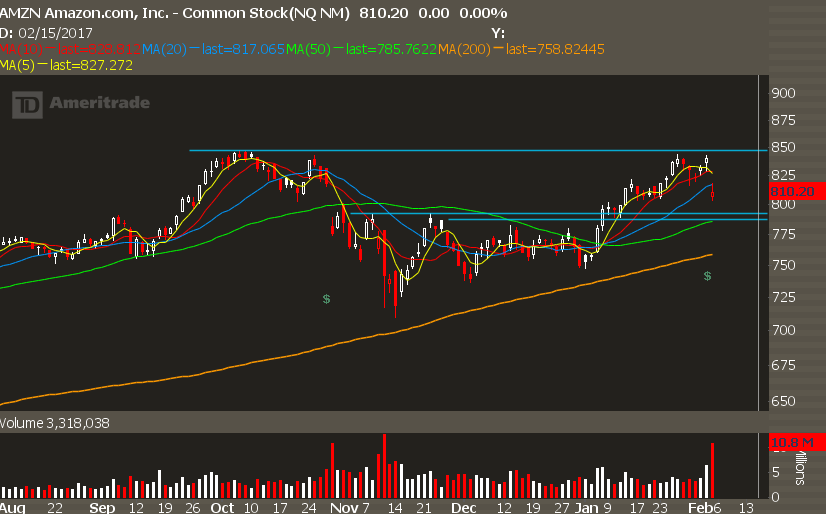
AMZN reported earnings and its revenue was light… this is leading to a gap down which potentially will take it to retest the previous resistance levels from November.
If we come into 790 then we want to start scaling into some put spreads.
Trade Setup
Expected Price: 790
Sell to Open AMZN Apr 720/715 Put Spread
Tier 1: Enter at 0.75, Exit at 0.25
Tier 2: Enter at 1.05, Exit at 0.75
Tier 3: Enter at 1.35, Exit at 1.05
Trade #2: FB
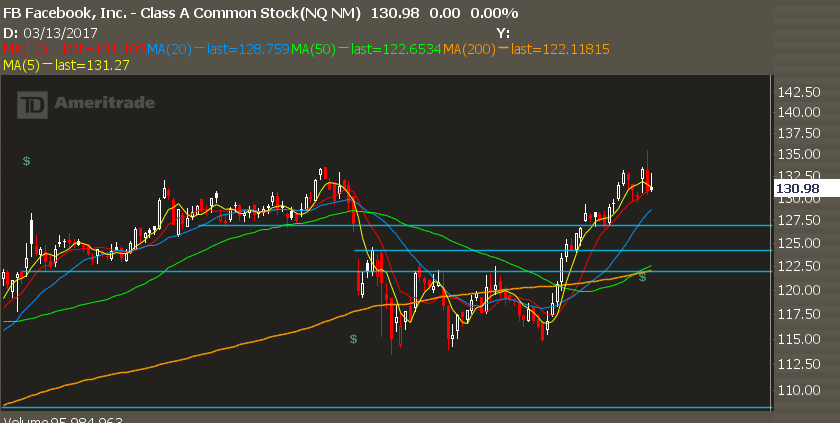
Very similar structure as the AMZN trade. Disappointing reaction to earnings may bring in some more sellers and come in to retest previous support levels.
Trade Setup
Expected Price: 124
Sell to Open FB Apr 115/110 Put Spread
Tier 1: Enter at 0.80, Exit at 0.30
Tier 2: Enter at 1.10, Exit at 0.80
Tier 3: Enter at 1.40, Exit at 1.10