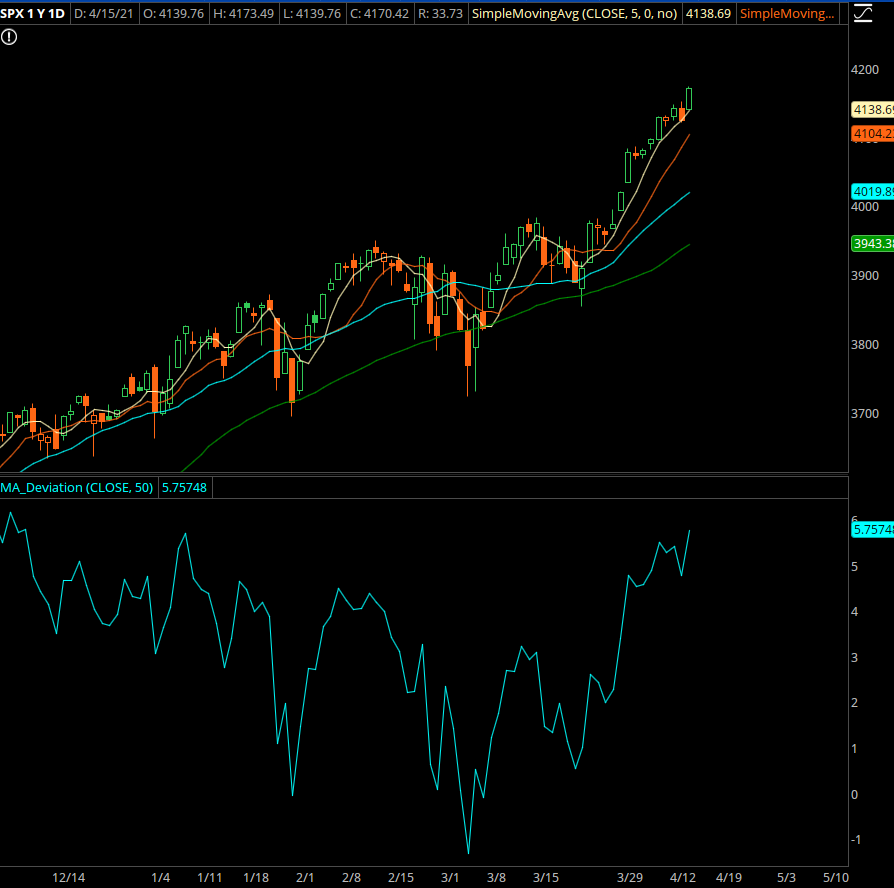
The indicator shown above is the percentage distance from the 50 day moving average. I use this not as a full-fledged entry signal, but instead to provide some context to the strength of the trend.
When we have high reversion and more pullbacks, the indicator will stay closer to zero. When things get stretched, then things can get weird.
In a “normal” market, going over 5% above the 50 DMA woul dbe absolutely wild. That’s the level we saw right before volmageddon back in 2018, and marked a short term top in the market after we had that nasty crash in 2018.
This is not a normal market. It hasn’t been normal for over a year. Low liquidity runs both ways– higher *and* lower. And when you have a ton of demand and no supply, prices go higher.
A few other machinations are adding fuel to the fire. You’ve got the tech runup, which I’ve talked about previously. When 5 stocks make up 40% of the movement in the S&P, it’s important to pay attention to them.
When NVDA pre-announces material numbers and the stock runs 100 points, that accounts for a good chunk of the rally at a 1% weighting. When GOOGL runs and has a 4% weighting, that moves it even more. And when MSFT ha a breakout from 230-260… well, at a 5% weighting that pushes it even higher.
The second part is I think there are some options-related things adding fuel to the fire. Remember what I just said– large companies can move the indexes.
Here’s how this can work…
NVDA pre-announces and a bunch of traders buy calls to play the spike. The option dealers end up short a ton of gamma and vanna, two greeks that we normally don’t care about but they do.
When they have that exposure, they have to buy shares as the stock rises, adding fuel to the fire. This convexity will carry over into the indices as dispersion books adjust and arb the changes in the name.
The clearest example was the tech wreck that happened back in Aug-Sep of last year. I don’t think we’re seeing that kind of extreme right now, but it absolutely is a factor in this market.
The lack of liquidity can run both ways. If the option dealers stop needing to hedge due to contract rolloffs, then that piece of demand goes away. And if funds want to sell a piece of their tech positions before they report earnings, that introduces supply into the markets.
That’s enough to move the needle for a rug pull.
I don’t know when, or even if, the market will have that kind of scenario setup. Earnings season could be a ripper… banks are pretty much done with theirs and the bids held… and the market could just grind up for a while.
Yet when has the market ever been that clean? The odds of reversion are higher and we could be facing just a normal pullback to retest the 4000’s.
Enough with the novel, let’s get to the setups.
Trade #1: NVDA
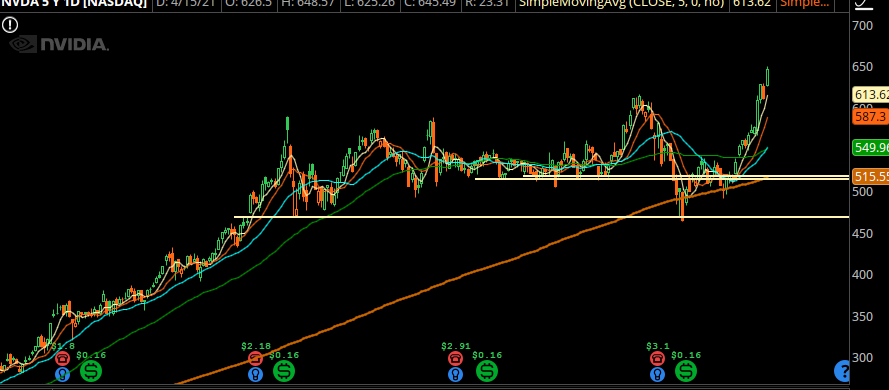
NVDA is running hot with the semiconductor sector, and while there is a good “first pullback” setup coming, I want to work with a parabolic fade first.
I want to get one more push higher on Friday, then start scaling in.
NOTE THE EXPIRATION — this is a weekly option so we don’t have earnings risk (even though some numbers are out already).
Trade Setup
Expected Price: 655
Sell to Open NVDA 14May21 690/700 Call Spread
Tier 1: Enter at 2.37, Exit at 1.07
Tier 2: Enter at 3.318, Exit at 1.97
Tier 3: Enter at 4.266, Exit at 2.65
Stop Out If Close Over 690.11
Trade #2: GLD
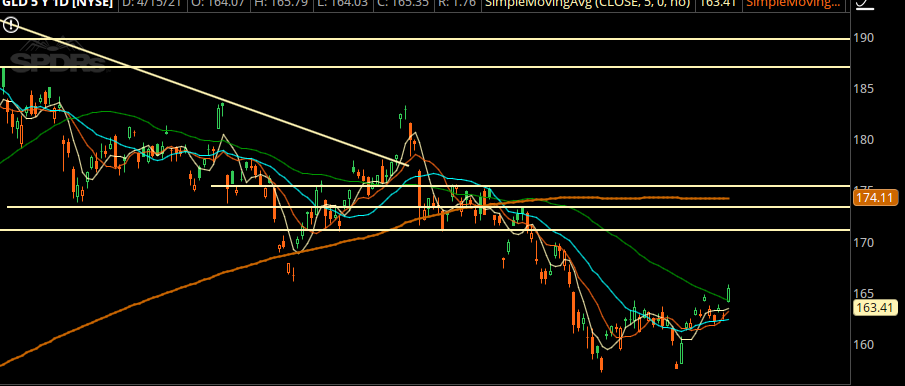
GLD managed to clear and hold above the resistance level from last month. Overall it is still in a downtrend, but I think the near term low is in. Looking for a small retracement to start scaling in.
Trade Setup
Expected Price: 164.78
Sell to Open GLD 18Jun21 158/155 Put Spread
Tier 1: Enter at 0.5, Exit at 0.07
Tier 2: Enter at 0.7, Exit at 0.24
Tier 3: Enter at 0.9, Exit at 0.31
Stop Out If Close Under 157.89
Trade #3: FDX
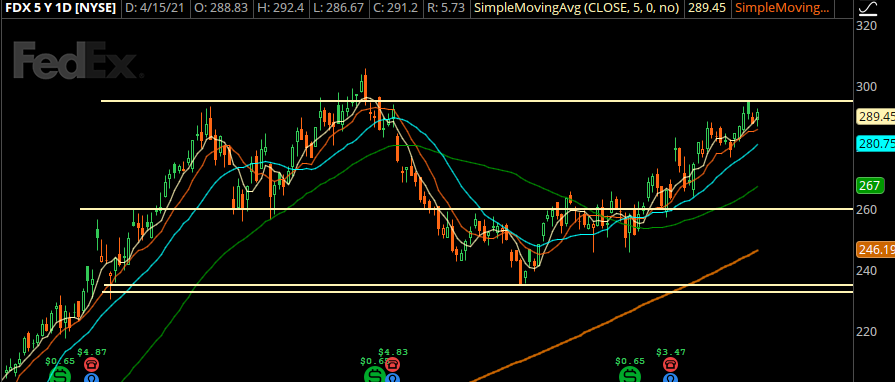
FDX rallied hard into its last resistance area. I’m looking for a pullback to create a “cup and handle” pattern. FDX earnings already out of the way, but UPS has some that could be proxy risk so keep an eye out for that.
Trade Setup
Expected Price: 281
Sell to Open FDX 18Jun21 260/250 Put Spread
Tier 1: Enter at 1.9, Exit at 0.52
Tier 2: Enter at 2.66, Exit at 1.19
Tier 3: Enter at 3.42, Exit at 1.57
Stop Out If Close Under 259.89