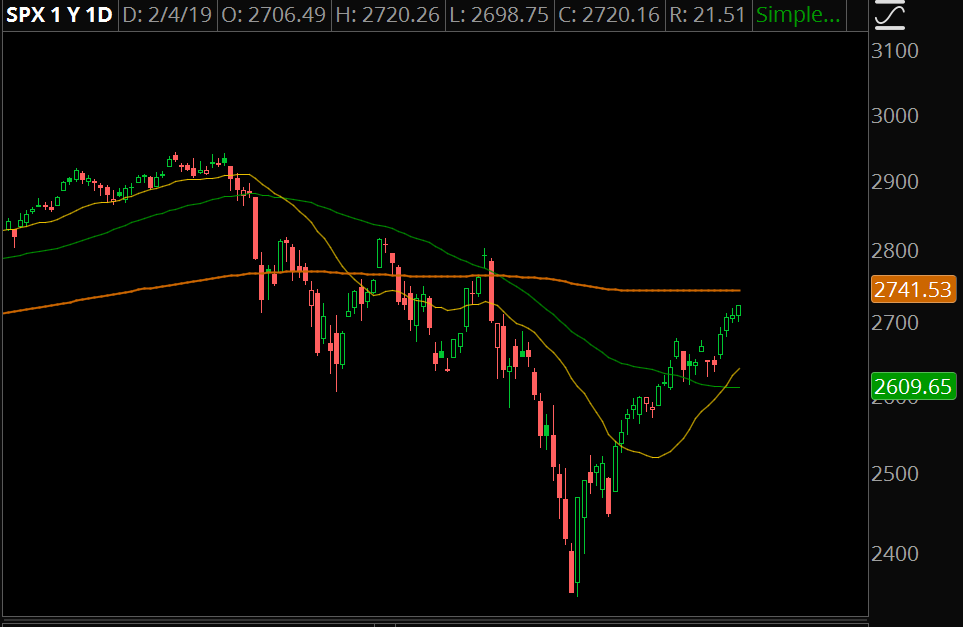
Often times, many times, when the market experiences a correction, the energy of the retracement mirrors the energy of the selloff. Currently, that’s what we’re seeing now, although the magnitude of the retracement is what has caught me (and many others) off guard.
Imagine for a moment that the December selloff was a liquidity event, meaning that there were some institutional blowups, coupled with the fact that all bids were pulled because it was headed into the end of the year, and anybody that wanted to buy had already closed up shop into 2019.
Imagine for a moment that the crack of 2600 hadn’t happened in December, but say 3 months earlier, when there was still plenty of liquidity in the system.
A crack underneath the first low and then a bounce is a hallmark bottoming pattern. It’s possible that the “crack” from 2600 to 2400 had to do more with the structure of the market.
I think the market is running a little hot here, and due for a pullback. Yet the expectation of a 2400 retest continues to diminish the longer we stay elevated like this. We don’t have to retest– See October 2014 as an example of a market that collapsed and aggressively v-bounced and never looked back.
In terms of tactics here… forcing your way into this market doesn’t seem like the best idea. Wait for the “exhale” lower and start scaling into put spread sales there.
Trade #1: WYNN
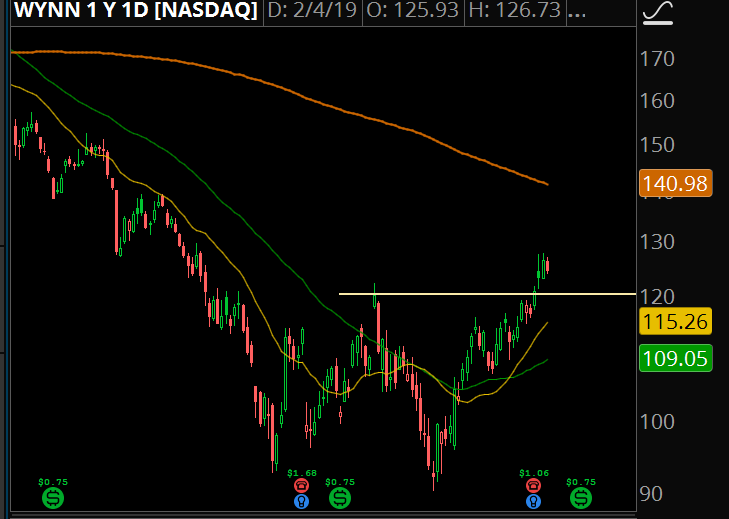
This is a relative strength name that bottomed earlier before the rest of the market. I want to see a retest of the recent highs.
Trade Setup
Expected Price: 120
Sell to Open WYNN Mar 110/105 put Spread
Tier 1: Enter at 0.90, Exit at 0.40
Tier 2: Enter at 1.20, Exit at 0.70
Tier 3: Enter at 1.50, Exit at 1.00
Trade #2: MA
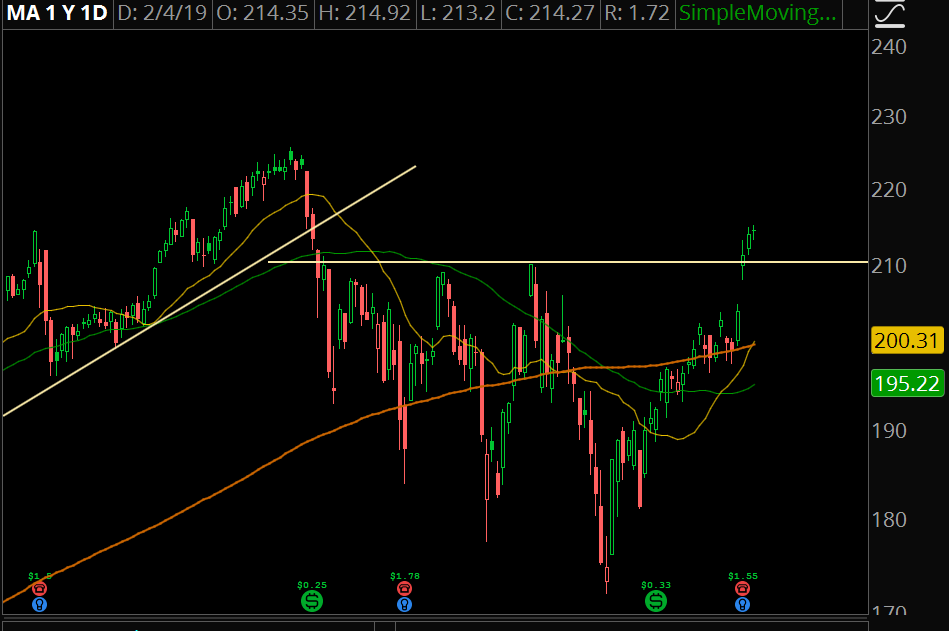
Looking for a retest of the previous resistance levels.
Trade Setup
Expected Price: 210
Sell to Open MA Mar 200/195 Put Spread
Tier 1: Enter at 0.81, Exit at 0.31
Tier 2: Enter at 1.11, Exit at 0.61
Tier 3: Enter at 1.41, Exit at 0.91