Here’s an example of how to use the Tier system to automate your executions with our Proactive Spread Alerts.
In this recording, I have a cold and my 2 year old daughter was banging the door down so be patient as I try to explain!
Become a Great Options Trader
Here’s an example of how to use the Tier system to automate your executions with our Proactive Spread Alerts.
In this recording, I have a cold and my 2 year old daughter was banging the door down so be patient as I try to explain!
Another week gone by, and another week of volatility compression in the books.
Since the rally late last year, we have seen a time-based correction. There are signs of a failed breakdown which lead to a retest of the upper end of the range, which I think has already been fulfilled.
It just seems like the market is waiting for something. A catalyst.
Now we’ve got stock earnings coming out now so that may act as something if a large firm reports numbers significantly different than what the market is pricing in.
And we’ve got US political risk with the changeover in the administration… but other than that I don’t see anything.
Which is a little concerning. When the risks aren’t super obvious and written in the headlines, that’s when we want to be a little cautious.
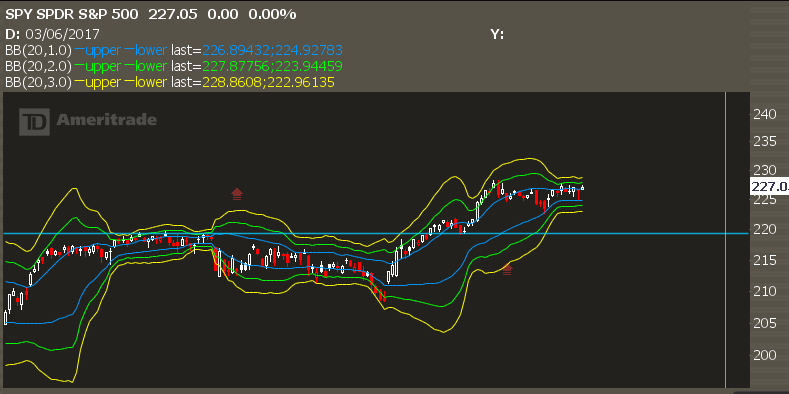
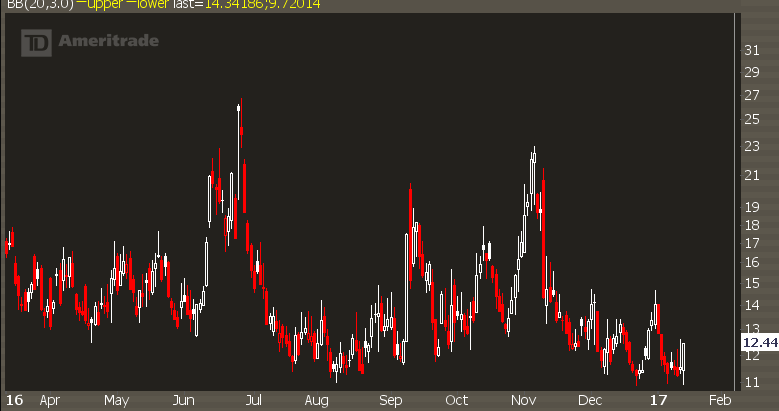
We also have the VIX at a floor and it’s been there for two months:
And stock correlations are pretty low:
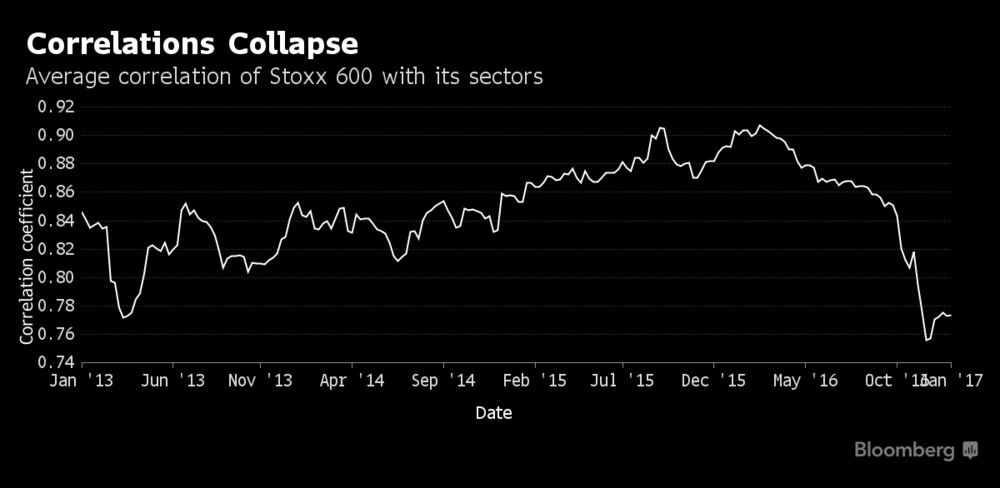
This is a chart of the European markets and how sectors aren’t running on the same conveyor belt… I’m seeing the same here in US stocks.
For us, that’s great… it means that individual stock setups are still there and we can pull out a good income in the markets.
However… at some point a catalyst will come into play and stocks will start trading on the conveyor belt together. It’s probably too early to make that call but it’s something I’m watching and I wanted to bring to your attention.
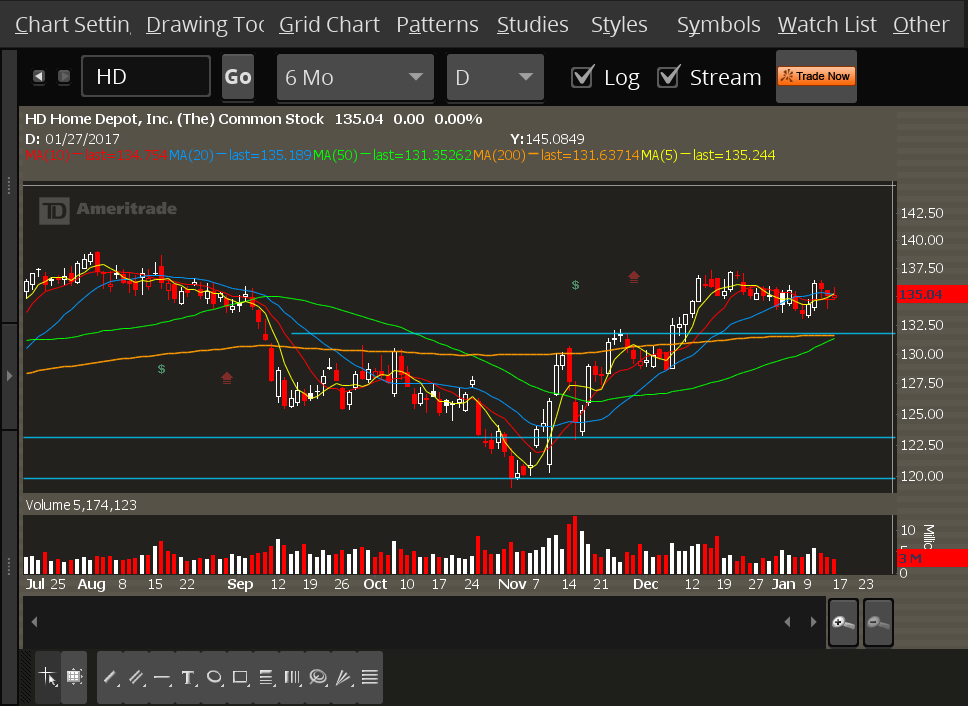
The stock has gone sideways for well over a month now. I suppose you could try and play the breakout, however I want to wait for a test of the low 130’s… previous pivot levels and a rising 50 day moving average come into play, making this a good risk/reward trade.
Trade Setup
Expected Price: 132.50
Sell to Open HD Mar 125/120 Put Spread
Tier 1: Open at 0.80, close at 0.30
Tier 2: Open at 1.10, close at 0.80
Tier 3: Open at 1.40, close at 1.10
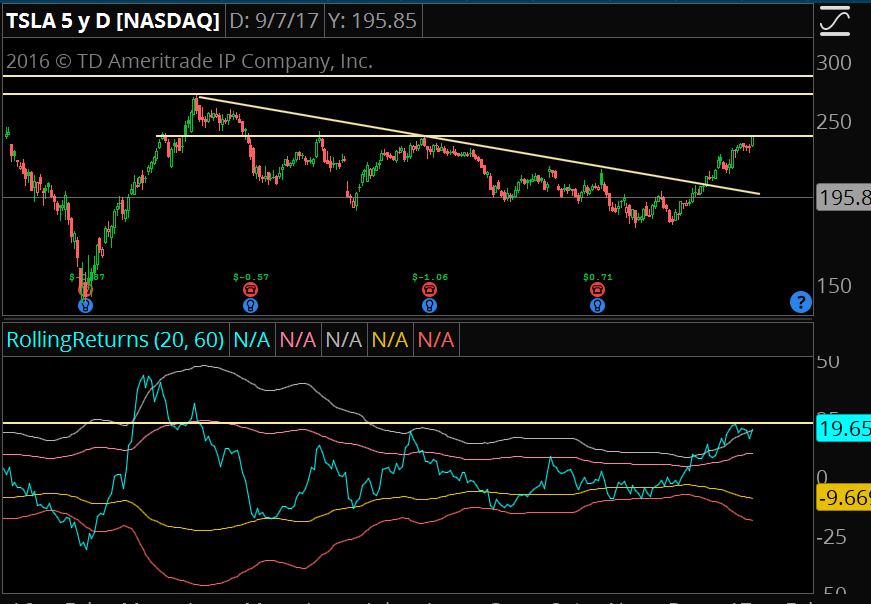
I’ll be completely upfront with you… I’m extremely hesitant to even suggest this trade. Shorting stocks has not been working and TSLA is a freight train right now.
However, the stock has rallied over 20% in the past month. This is normally the time momentum significantly slows down.
Now because this has earnings next month, I don’t want to put on anything too aggressive. This is a “whites of their eyes” trade where I only want to play it if it truly goes parabolic.
That means I need to see another 20 points out of the stock before I even consider putting on this trade.
Trade Setup
Expected Price: 250
Sell to Open TSLA Mar 285/290 Bear Call Spread
Tier 1: Open at 0.75, close at 0.25
Tier 2: Open at 1.05, close at 0.75
Tier 3: Open at 1.35, close at 1.05
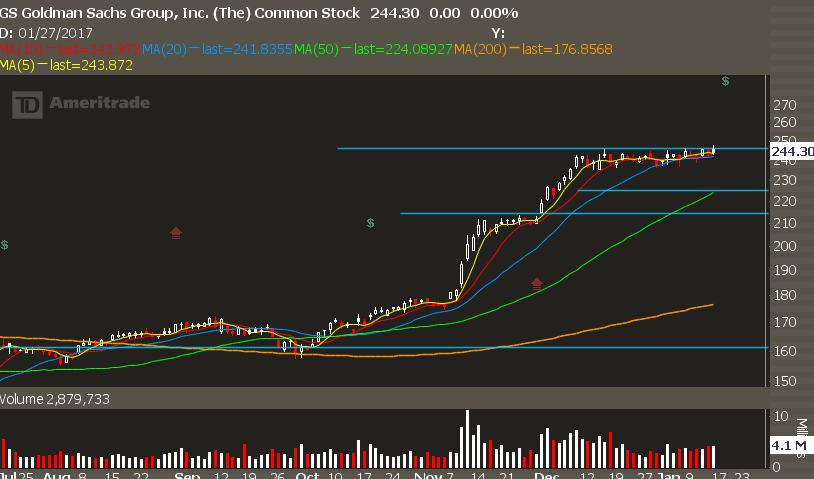
Large cap financials are all getting their earnings reports out of the way, and what I’m seeing so far is a lack of positive response after the earnings report.
While GS has yet to report, other names like JPM and BAC already have… so far they look like failed breakouts.
Given how far this sector has moved, it makes sense to anticipate a pullback. Be ready for a move to 230 quickly and start fading it there.
Right now March options aren’t open, but they will be at the end of the week. I’ll plan a trade with April options, but move to March if it isn’t filled this week.
Trade Setup
Expected Price: 230
Sell to Open GS Apr 205/200 Put Spread
Tier 1: Open at 0.80, close at 0.30
Tier 2: Open at 1.10, close at 0.80
Tier 3: Open at 1.40, close at 1.10
Markets continue to chop around in the range established from last month. Because the overall trend is up, we need to assume that when volatility expansion does occur it will be higher.
The trade has certainly been rotational in nature. We’ve seen some heavy selling hit the oil sector, while healthcare and tech help to buoy the market. And from the look of it… everything else has been in a super tight holding pattern since December. XLF (financials) is a great example of that.
I personally would prefer a little more vol to come in the market. I’d like to see some stop runs, and some shakeouts as it makes my trades a lot easier to execute. But we don’t yet have evidence that this will come into play.
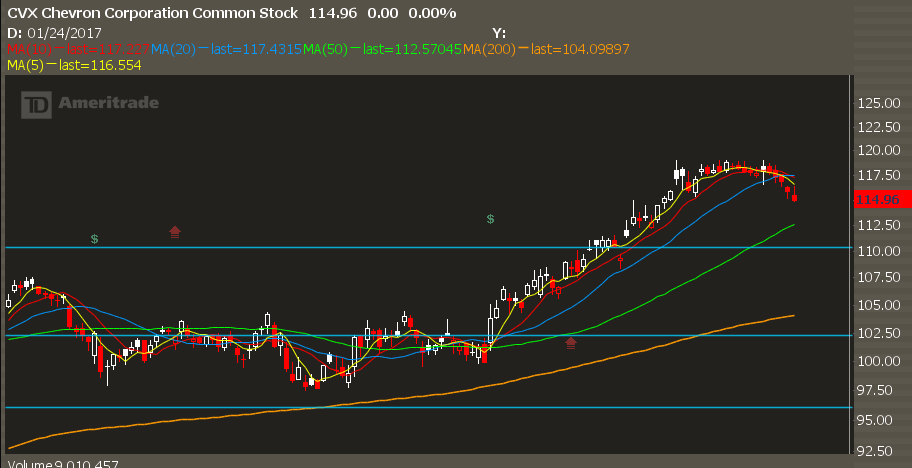
The stock broke down in the short term and looks ready to test some levels not seen since late last year. We have an inclining 50 day moving average, as well as key pivot levels at 110 and 106.
Trade Setup
Expected Price: 112.50
Sell to Open CVX Mar 105/100 Put Spread
Tier 1: Enter at 0.70, exit at 0.20
Tier 2: Enter at 1.00, exit at 0.70
Tier 3: Enter at 1.30, exit at 1.00
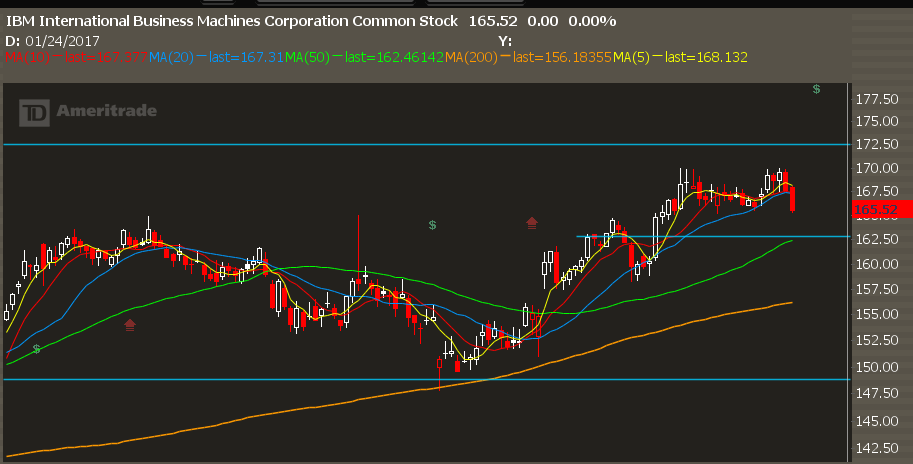
This one will be a little more copmlex to understand…
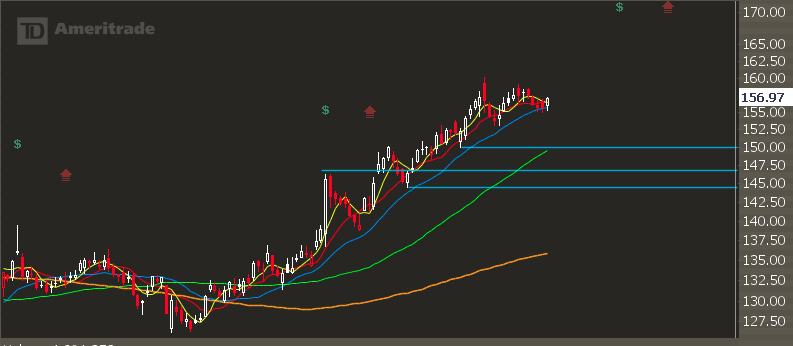
See, IBM has earnings next week, and it’s starting to look a little weak. I think that you could sell put spreads into the 162.50 level, but check out this chart:
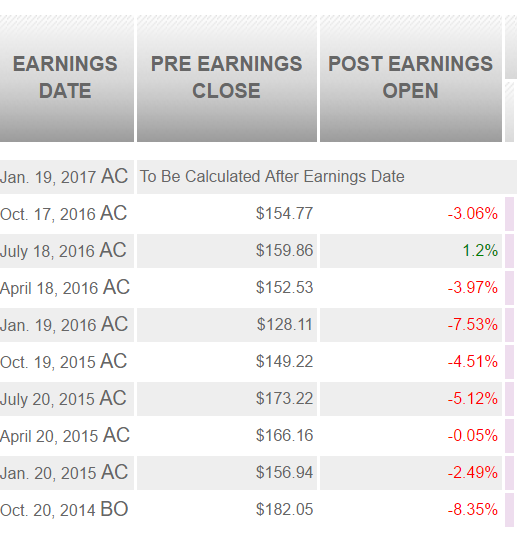
IBM has a very, very strong tendency to head lower after earnings. So I want to play put spread sales after earnings if we manage to see a decent gap lower.
Because we don’t know exactly how IBM will trade post earnings, figuring out expected prices will be a little more complicated.
Trade Setup
Expected Price: Low 160’s… wait for after earnings
Sell to Open IBM Mar 150/145 Put Spread
Tier 1: Enter at 0.70, exit at 0.20
Tier 2: Enter at 1.00, exit at 0.70
Tier 3: Enter at 1.30, exit at 1.00
I think the past two weeks of price action perfectly showcase the trading theme I have for this year.
Where we get a shakeout, but not a big enough one to trigger proper oversold readings. Just enough to shake a few weak hands out of the market… and then we continue on the trend higher.
So if you’ve been waiting for a deeper pullback, it’s been frustrating. We have seen a market correction — the correction took place over time instead of over price. Remember, markets can work off overbought readings simply by going sideways and having a rotational correction.
The next catalyst we have coming up is earnings. Odds are we will grind higher into that, as some of the larger market cap stocks start to run in anticipation of this next earnings cycle. Hopefully after earnings we get some stocks that have some good volatility to take advantage of.
Let’s take a look at two setups…
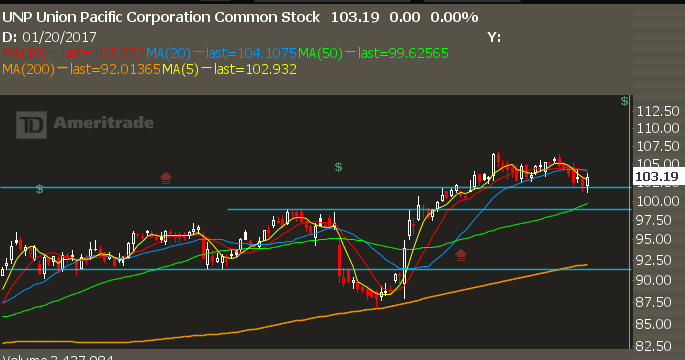
Still looking for 100 on this stock. It’s possible we don’t get it and buyers come back in force, but I want to make sure I get the best prices.
100 is the big pivot level from a few months ago, along with a rising 50 day moving average. Into that I want to put on some risk.
Now this stock does have earnings coming up in 10 calendar days, so consider keeping size low and if the stock runs lower then you really take advantage of it. Past adverse earnings have taken the stock down -8% but have faded back higher… that’s another setup to consider if we don’t get this one.
Trade Setup:
Expected Price: 100
Sell to Open UNP Feb 90/85 Put Spread
Tier 1: Sell to Open @0.50, Buy to Close @0.10
Tier 2: Sell to Open @0.80, Buy to Close @0.50
Tier 3: Sell to Open @1.20, Buy to Close @0.80
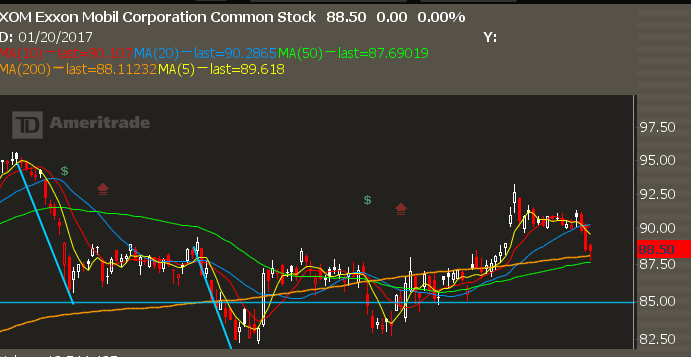
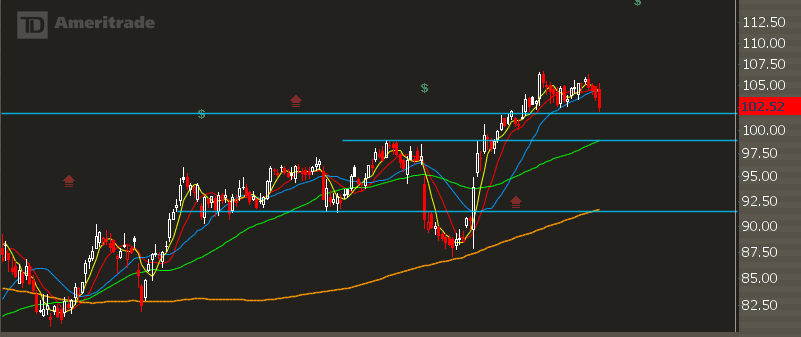
XOM finally filled the gap from last month. It’s also come into previous resistance at 87.50, which is now potential support. There’s also a double bottom pattern that formed over the past few months that should act as levels of resistance.
Now crude oil has been a little soft. It had an ugly fading day on Jan 3rd, and if it continues to sell off I expect $50/bbl and oil stocks should follow. However, this is good risk/reward to initiate a position.
Trade Setup:
Expected Price: 100
Sell to Open XOM Mar 82.50/80 Put Spread
Tier 1: Sell to Open @0.35, Buy to Close @0.10
Tier 2: Sell to Open @0.50, Buy to Close @0.35
Tier 3: Sell to Open @0.65, Buy to Close @0.50
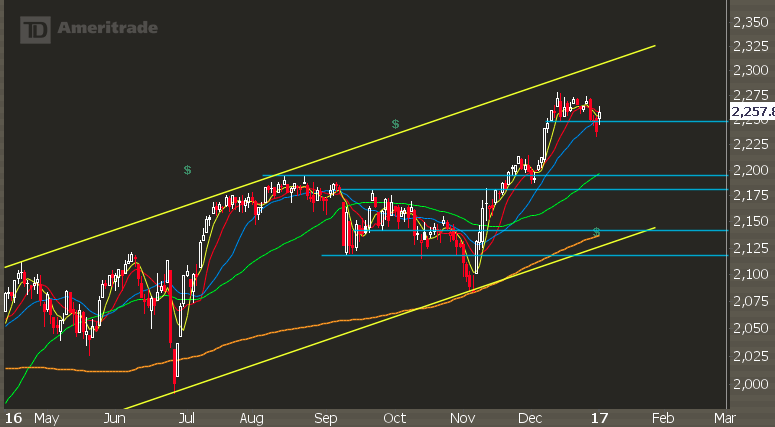
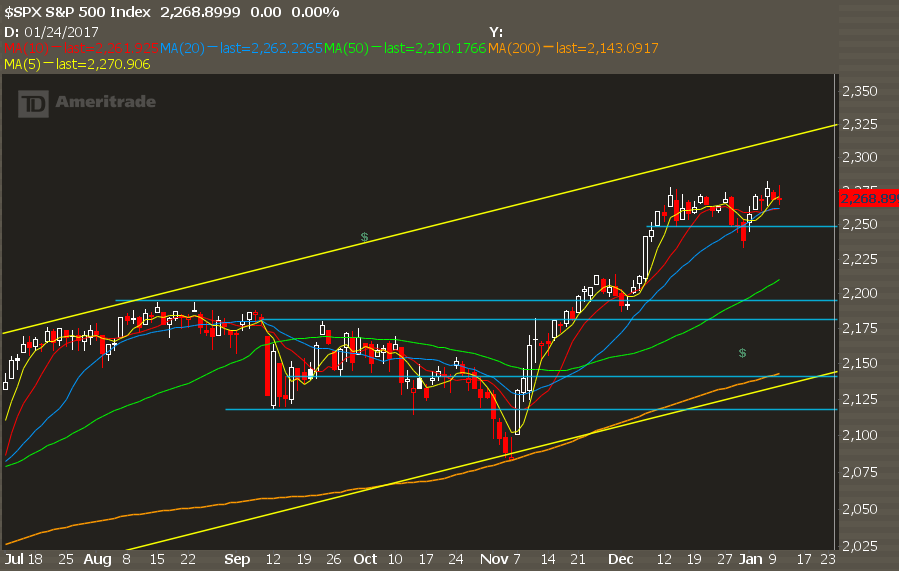
The market just can’t find any downside followthrough.
In technical analysis, so many people look for patterns that are successful. Yet it’s just important to understand pattern failure.
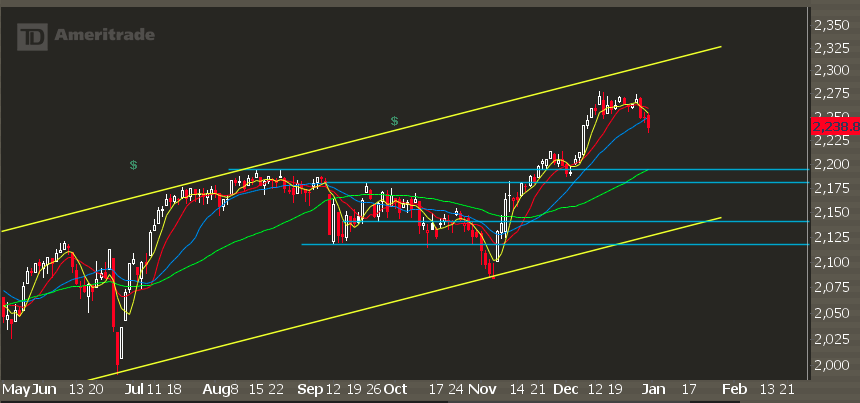
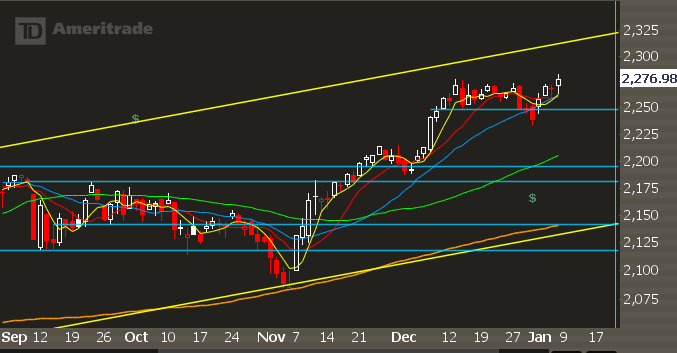
So over the past two weeks, the market has been correcting between 2250 and 2275… a 25 handle range. Not a ton of volatility.
And into the end of the year, the market cleared under that support level, indicating a breakdown of support and potential to the downside.
But on Tuesday, when the markets opened for 2017, we saw a failed breakdown. This tends to be bullish and leads to followthrough towards the upper end of the range.
Core thesis remains the same. It will be a grind, most likely higher, with rotation in and out of different pockets of the market. Our job is to simply identify the best risk/reward when trending stocks go out of favor in the short term.